Chess Vizualizer
Project Description
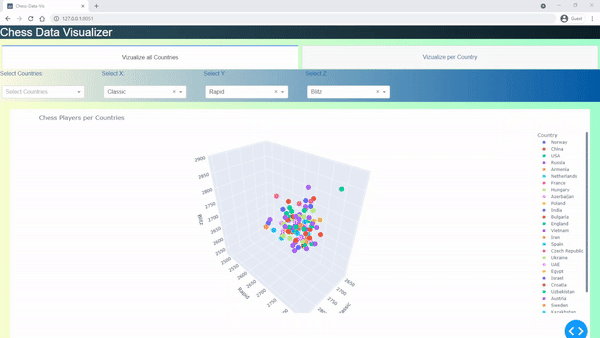
This project was built using Dash by Plotly.
We used a dataset from Kaggle that includes player rankings per country and outcomes from individual chess games.
The goal was to create an interactive and intuitive data visualization experience, far more engaging than static tables or documents. We utilized Plotly Dash to build a user-friendly dashboard that allows dynamic exploration based on user selections.
This project also demonstrates how fast dashboards can be developed and deployed within internal networks or cloud services such as AWS and Azure.
You are welcome to explore the source code or run the Docker container on your preferred machine to see it in action.
You want to see more?
Docker
Download and run the Docker image of the project
Github
You may visit the gihub repository of the projectt
kaggle
You can take a closer look from kaggle dataset